C
Chrome Debugger MCP Server
chrome-debugger-mcp
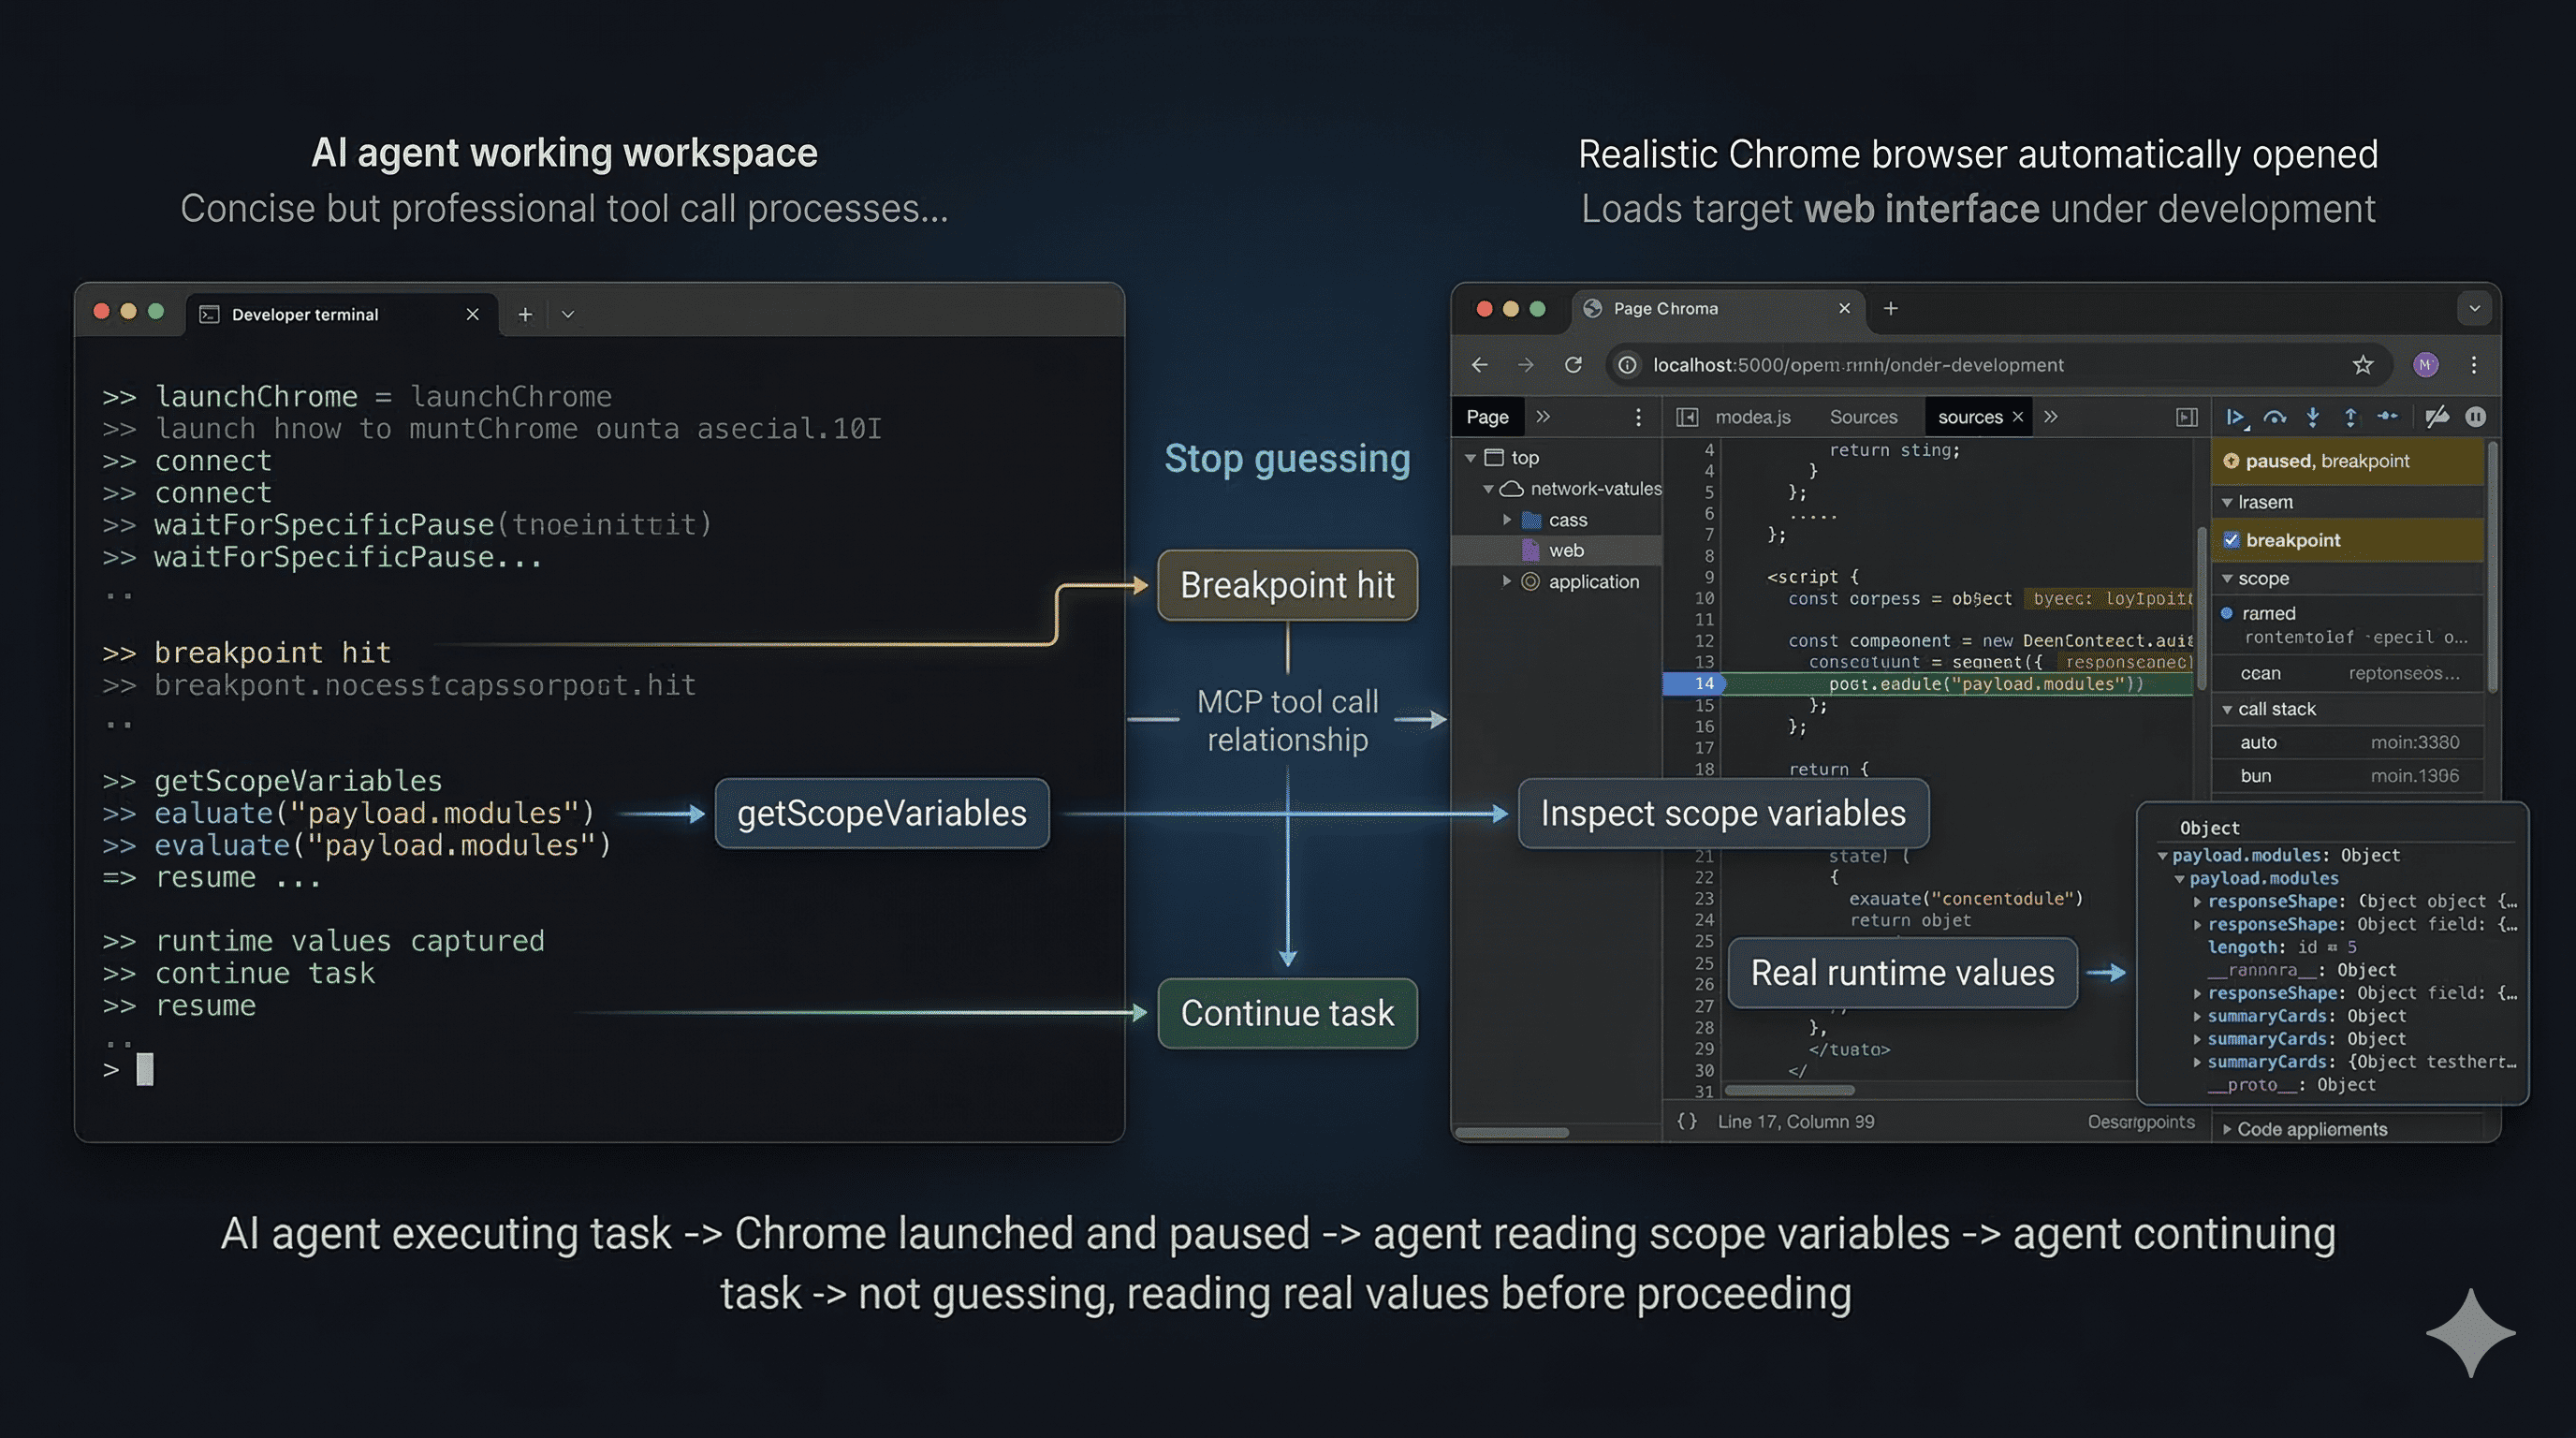
Chrome breakpoint debugging MCP server for inspecting runtime values and stepping through code
No known CVEs
No license
Maintained
Last commit 124d ago
Works with most clients
Transport: stdio, sse
17 tools · ~993 tok
Grade B · 0.5% of 200K ctx
Step 1
Install in your client
Config is the same across clients — only the file and path differ.
CD
Supported in Claude Desktopstdio, sse · Node 18+
Paste into ~/Library/Application Support/Claude/claude_desktop_config.json
{
  "mcpServers": {
    "chrome-debugger": {
      "args": [
        "-y",
        "chrome-debugger-mcp"
      ],
      "command": "npx"
    }
  }
}
Are you the author?
Add this badge to your README to show your security score and help users find safe servers.
Embed in your READMEAbout badges →
[](https://mcppedia.org/s/io-github-bitepro-chrome-debugger-mcp)
Read me
What Chrome Debugger MCP Server does
An MCP server for breakpoint-driven Chrome debugging.
Test This Server
Run this in your terminal to verify the server starts. Then let us know if it worked — your result helps other developers.
npx -y 'chrome-debugger-mcp' 2>&1 | head -1 && echo "✓ Server started successfully"
After testing, let us know if it worked:
Loading README…
Scored, not listed
Why this score
Five weighted categories — click any category to see the underlying evidence.
Score breakdown
75/100across 5 weighted dimensions
0255075100
30
16
15
10
−25
Security
Maintenance
Efficiency
Documentation
Compatibility
Categoriesclick a row to see evidence
Security
OSV.devNo known CVEs.
Checked chrome-debugger-mcp against OSV.dev.
Inventory
Tools (17)
Click any tool to inspect its schema.
~993 tokens total
Community
Reviews
Be the first to review
Have you used this server?
Share your experience — it helps other developers decide.
How easy was setup?Did it work reliably?How was the documentation?
Sign in to write a review.
Frequently Asked Questions
- Is Chrome Debugger MCP Server safe to use?
- Chrome Debugger MCP Server has no known CVEs as of the latest MCPpedia security scan. It does not require authentication, so any local process can connect — keep this in mind in shared environments.
- How do I install Chrome Debugger MCP Server?
- Chrome Debugger MCP Server supports copy-paste install configs on its MCPpedia page for Claude Desktop, Cursor, and Claude Code. Scroll to the Quick Install section and select your client.
- What can Chrome Debugger MCP Server do?
- Chrome Debugger MCP Server provides 17 tools: startDebuggingSession, launchChrome, listTargets, connect, setBreakpoint and 12 more. See the full tools list on the server page for descriptions and parameters.
- What AI clients work with Chrome Debugger MCP Server?
- Chrome Debugger MCP Server is compatible with claude-desktop, cursor, claude-code. It uses stdio and sse transport.
- Is Chrome Debugger MCP Server actively maintained?
- Chrome Debugger MCP Server is less actively maintained — last commit was 124 days ago. It has 1 GitHub stars.
Related
Similar servers
Others in developer-tools / browser
Copy/paste detector for programming source code, supports 223 formats. AI-ready with token-efficient reporter, skill and MCP server.
5.8k 1
X
XcodeBuildMCP95XcodeBuildMCP provides tools for Xcode project management, simulator management, and app utilities.
6.0k 1
A Model Context Protocol (MCP) server and CLI that provides tools for agent use when working on iOS and macOS projects.
6.0k 2
Manage Supabase projects — databases, auth, storage, and edge functions
2.8k 4
MCP Security Weekly
Get CVE alerts and security updates for Chrome Debugger MCP Server and similar servers.
Community
Discussion
Start a conversation
Ask a question, share a tip, or report an issue.
Has anyone used this with Cursor?How do you handle auth?Any alternatives?
Sign in to join the discussion.